Today i want show a problem discovered on one of our Zabbix Server and the Housekeeper process.
Housekeeper (Zabbix documentation)
The Housekeeper is a periodical process, executed by Zabbix server. The process removes outdated information and information deleted by user.
Most of us know the two parameters inside zabbix_server.conf to limit the process behavior:
HousekeepingFrequency
The Housekeeper is a periodical process, executed by Zabbix server. The process removes outdated information and information deleted by user.
MaxHousekeeperDelete
No more than ‘MaxHousekeeperDelete‘ rows will be deleted per one task in one housekeeping cycle.
Actually for most of the times no one care so much about that but today we fall on a big Zabbix Server slow down and this problemi s coming from Housekeeper.
Today we understood much better the logic behind the Housekeeper process, i will try to explain below.
Few days ago we have removed 3 items prototypes from a template that it was linked to 60 hosts and for every hosts that prototype items is near to 300 real items.
So how many orphaned items we have? 3 (proto items) *60 (hosts)*100(expanded proto items)=18000 !
But the huge strange behaviour is here, MaxHousekeeperDelete. If we set to MaxHousekeeperDelete=500 zabbix will try to remove 500 history value per orphaned items.
So what happend?
In the beginning the Housekeeper process it will try to remove 18000×500=9.000.000 of history value!!!!
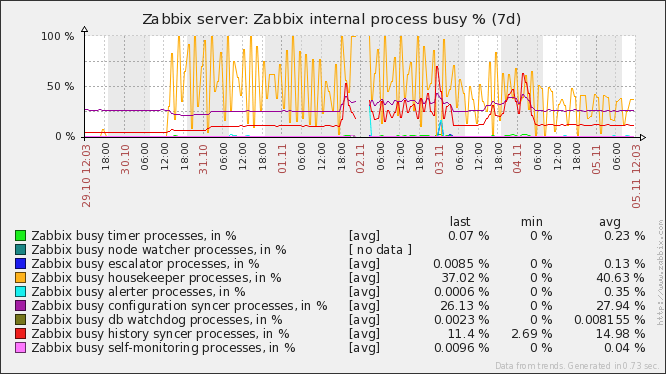
For example if we look on Zabbix server Log:
————–
housekeeper [deleted 68 hist/trends, 4522000 items, 0 events, 0 sessions, 0 alarms, 0 audit items in 2649.273207 sec, idle 1 hour(s)]
————–
The “4522000 items” is the deleted orphaned items value for a single Housekeeper process.
To discuss about this strange logic we have opened an official trouble ticket in Zabbix
Never see a so great tool to debug our Linux server, please check this post How to monitor and troubleshoot a Linux server using sysdig
I’m please to announce the new Zabbix Certify Specialists of october 2014, if you want to become the next one please check the official zabbix training schedule.
Today i have found a big problem, my Trends table is very huge (>250GB) how can i fix this problem?
Digging on Internet i found an easy solution and it comes from our Zabbix Community 🙂
Link: Zabbix DB Cleaning
Today i have found a lot of news about our Monitoring tool!
I have translated this very good article from a russian website, every award is for http://habrahabr.ru/, thanks so much.
Introduction
Now exactly how this was done.
Seemingly simple: iLO can give data through IPMI, and Zabbix has native support for this protocol, but, as usual, was smooth on paper. When we look at the issue once there are three problems:
In connection with the foregoing, it was decided to write a separate mechanism for interaction with iLO, relying on scripts and other utilities to work with IPMI. As a programming language was chosen perl, as well as a data source – package freeipmi . On all servers in the wards iLO account was created to monitor read-only rights. Logically, the entire structure is divided into two parts:
Just want to note that perl programmer and I am not used to solve problems of those examples and designs that were clear to me, the end result was achieved – all this works successfully.
This provides data in a script format zabbix discovery according to which class the data was requested – sensors, chassis information, and so forth. Such separation is due to the logic of the template that is used in conjunction with scripts.
This script outputs the value of specific sensors – again, depending on what class of data has been requested. The obtained data is cached in a text file, so you do not accidentally zaddosit iLO simultaneous requests.
Write scripts – half the battle. Had yet to properly configure the import of all of this information to Zabbix and configure the triggers. The result of this work was the monitoring template, which established rules for detecting all sensors and other data sources and automatically create a corresponding triggers and graphs.
For practical application of the above construction is necessary:
# wget http://ftp.gnu.org/gnu/freeipmi/freeipmi-1.2.1.tar.gz# tar -xvzf freeipmi-1.2.1.tar.gz # cd freeipmi-1.2.1 # ./configure –prefix=/usr –exec-prefix=/usr –sysconfdir=/etc –localstatedir=/var –mandir=/usr/share/man# make install
./configure –prefix=/usr –exec-prefix=/usr –sysconfdir=/etc –localstatedir=/var –mandir=/usr/share/man –libdir=/usr/lib64
# /usr/sbin/ipmi-sensors -D LAN2_0 -h 192.168.0.1 -u monitor -p P@$$w0rd -l USER -W discretereading –no-Header-output –quiet-cache –sdr-cache-recreate –comma-separated-output –entity-sensor-names
0,System Chassis 1 UID Light,OEM Reserved,N/A,N/A,‘OEM Event = 0000h’1,System Chassis 2 Health LED,OEM Reserved,N/A,N/A,‘OEM Event = 0000h’2,Processor Module VRM 1,Power Unit,N/A,N/A,‘Device Inserted/Device Present’3,Power Supply Power Supply 1,Power Supply,N/A,N/A,‘Presence detected’
# /usr/lib/zabbix/externalscripts/ilo_discovery.pl 192.168.0.1 sensor temp numeric
{“data“:[ { “{#CLASS}“:“sensor”, “{#KEY}“:“Air Inlet 01-Inlet Ambient”, “{#SECTION}“:“Temperature”, “{#TYPE}“:“numeric”, “{#MEASURE}“:“C”}, { “{#CLASS}“:“sensor”, “{#KEY}“:“Processor 02-CPU”, “{#SECTION}“:“Temperature”, “{#TYPE}“:“numeric”, “{#MEASURE}“:“C”},{“{#CLASS}“:“sensor”,“{#KEY}“:“Air Inlet 01-Inlet Ambient”,“{#SECTION}“:“Temperature”,“{#TYPE}“:“numeric”,“{#MEASURE}“:“C”},{“{#CLASS}“:“sensor”,“{#KEY}“:“Processor 02-CPU”,“{#SECTION}“:“Temperature”,“{#TYPE}“:“numeric”,“{#MEASURE}“:“C”},


This monitoring mechanism has been successfully tested with HP Proliant server series DL, ML and BL 5, 6, 7 and 8 generations.General recommendation – try before applying it to update to the latest versions of iLO firmware. As for the younger line of servers, having on board instead Lo100 iLO – with them all this will work too, but some of the information obtained from the older models of the same generation, will not be available because lo100 sends less data than iLO.